
Why stock-market bulls are obsessed with the 4,231 level for the S&P 500
[ad_1]
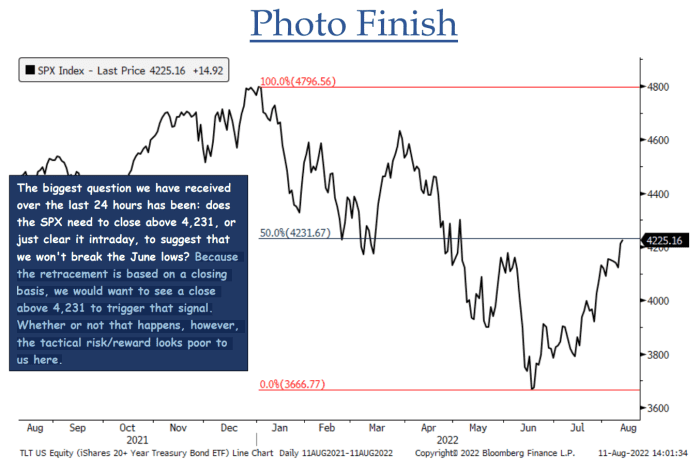
The S&P 500 index looked set Friday to take another run at a technical level that could deliver a big dose of encouragement to stock-market bulls arguing that the bear-market bottom is in, though chart watchers warned that it might not be a signal to go all in.
Through Thursday’s close, the S&P 500
SPX,
has rallied 14.7% off its 2022 closing low of 3,666.77 set on June 16. A close above 4,231 would mean the large-cap benchmark has recovered — or retraced — 50% of its fall from a Jan. 3 record finish at 4796.56.
“Since 1950 there has never been a bear market rally that exceeded the 50% retracement and then gone on to make new cycle lows,” said Jonathan Krinsky, chief market technician at BTIG, in a note earlier this month.
The S&P 500 traded as high as 4,257.91 on Thursday, but gave up gains to end at 4,207.27. Stock-index futures on Friday morning pointed to gains for major indexes, including the Dow Jones Industrial Average
DJIA,
and the Nasdaq Composite
COMP,
Krinsky, in a Thursday update, noted that an intraday breach of the level doesn’t cut it (see chart below).
BTIG
“Because the retracement is based on a closing basis, we would want to see a close above 4,231 to trigger that signal. Whether or not that happens, however, the tactical risk/reward looks poor to us here,” he wrote.
Why is 50% important? Many technical analysts pay attention to what’s known as the Fibonacci ratio, attributed to a 13th century Italian mathematician known as Leonardo “Fibonacci” of Pisa. It’s based on a sequence of whole numbers in which the sum of two adjacent numbers equals the next highest number (0,1,1,2,3,5,8,13, 21…).
If a number in the sequence is divided by the next number, for example 8 divided by 13, the result is near 0.618, a ratio that’s been dubbed the Golden Mean due to its prevalence in nature in everything from seashells to ocean waves to proportions of the human body. Back on Wall Street, technical analysts see key retracement targets for a rally from a significant low to a significant peak at 38.2%, 50% and 61.8%, while retracements of 23.6% and 76.4% are seen as secondary targets.
The push above the 50% retracement level during Thursday’s recession may have triggered selling, said Jeff deGraaf, founder of Renaissance Macro Research, in a Friday note.
He observed that the retracement corresponded to a 65-day high for the S&P 500, offering another indication of an improving trend in a bear market as it represents the highest level of the last rolling quarter. A 65-day high is often seen as a default signal for commodity trading advisers, not just in the S&P 500 but in commodity, bond and forex markets as well.
“That level coincidentally corresponded with the 50% retracement level of the bear market,” he wrote. “In essence, it forced the hand of one group to cover shorts (CTAs) while simultaneously giving another group (Fibonacci followers) an excuse to sell.”
Krinsky, meanwhile, cautioned that previous 50% retracements in 1974, 2004, and 2009 all saw decent shakeouts shortly after clearing that threshold.
“Further, as the market has cheered ‘peak inflation’, we are now seeing a quiet resurgence in many commodities, and bonds continue to weaken,” he wrote Thursday.
[ad_2]
Read More:Why stock-market bulls are obsessed with the 4,231 level for the S&P 500
 Canada
 Japan
Japan Germany
 Australia
 United States
 United Kingdom
 China
China France
 Ukraine
 Russia
 Turkey